
Amplifier power is probably the most misunderstood and abused parameter of amplifiers and speakers. Yet, it is often the first (and possibly only) parameter people look at when buying an amplifier or speakers.
Marketing managers add to the confusion by using terms like RMS power, continuous average power, music power, peak power, dynamic power, maximum power etc.
Understanding amplifier power will help in understanding the terms often used (and abused) to describe amplifier power. This article will explain what amplifier power is, and what is it is not. Further articles will explain how amplifier manufacturers measure power, what speaker power is and how to match your amplifiers and speakers. Before all that we need to understand amplifier power.
Amplifier Power is Calculated, not Measured
A Voltmeter measures voltage in volts. An Ammeter measures current in amps (amperes). An Ohmmeter measures resistance in ohms. Any two of these measurements will allow calculation of amplifier power (in watts). Unfortunately this means using some math and some formulas. I’ll try to keep it simple and only use one formula. If you like formulas and want to understand how power, voltage, current and resistance inter-relate, you can read my articles on Electrical Power and Ohms law. Otherwise, accept the following formula:
Power = Voltage squared divided by Resistance.
Let’s use this formula with a simple example. Let’s say you have an amplifier connected to a 5 ohm load (I’ve used 5 ohms to keep the calculations simple – normally it would be 4 ohms or 8 ohms for a speaker). With a constant sine wave input, you measure 10 volts AC on the speaker output of the amplifier. Since you know the resistance (5 ohms) and the voltage (10 volts), you can calculate the power:
Power = (10 times 10) divided by 5 = 100/5 = 20 watts.
Simple eh?
Understanding AC Measurements
Well that was a simple example. In reality it is not that simple for a number of reasons. The major complication is the output is not a constant level because the input is not a constant level. Let’s start with the simple input of a sine wave. The output would also be a sine wave, like this:
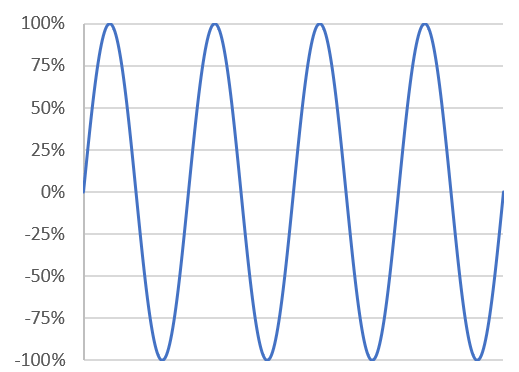
As you can see, the input and output is not constant. It is continuously going up and down, positive and negative. This is the case for any AC (Alternating Current) signal. Yet when you measure it with a meter, you get a constant voltage. This is because a meter tells you the RMS voltage.
RMS stands for Root Mean Square (which you can now forget). It is a mathematical term for what is effectively the working voltage. It is a calculation to determine the equivalent heating effect of a DC voltage. No need to get too involved in how RMS is determined, just remember it is the effective working voltage. It is also the voltage that your meter measures. It is 70.7% of the peak voltage.
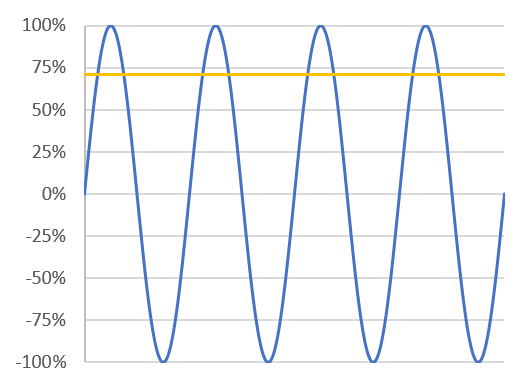
This is the case for all AC measurements. For example, the power outlet in some countries is 120 volts AC – this is the RMS voltage. The sine wave of 120 volts AC goes from +169.5 volts to -169.5 volts or a peak to peak (p-p) voltage of 339 volts. 70.7% of 169.5 volts gives the RMS voltage of 120 volts. In countries using 230 volts, the peak voltage is +/- 325.3 volts.

Measuring Amplifier Voltage and Current
OK, now we know RMS is the effective working voltage (and current) of AC. How does this help us with understanding amplifier power? Glad you asked.
In our simple example above we measured 10 volts RMS at the output of the amp. This means the output actually went from +14.14 volts to -14.14 volts. 70.7% of 14.14 volts is 10 volts.
Calculating Amplifier Power
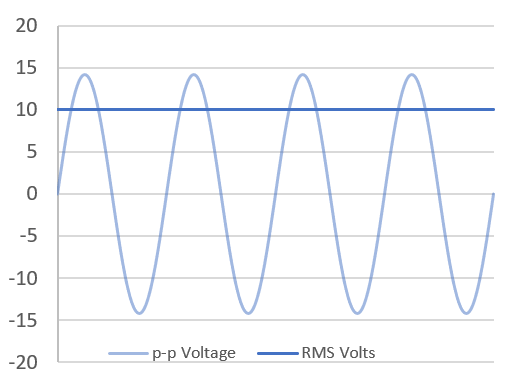
Now the fun part. We said earlier that power equals voltage squared divided by the resistance. This is true at any point along the sine wave. So if we take the voltage value (shown in blue) and square it (multiple it by itself) and then divide that by the constant resistance (5 ohms), we would get the power output as shown in orange:

A couple if things to note from this graph:
- Firstly, AC power does not go positive and negative. It is always positive. Therefore the RMS calculation does not apply.
- Secondly, the power is 40 watts peak to peak. However, you can’t say the power of the amplifier is 40 watts because it is only that at the peaks of each sine wave, not at any other time.
You can use my Amplifier Power, Voltage and Current Calculator to easily see the RMS and Peak values for your amplifier based on it specifications.
Now let’s look at the RMS values. In our example, we know the RMS voltage is 10 volts. We saw earlier that 10 squared is 100, and 100 divided by 5 gives us a calculated power of 20 watts. Let’s see what happens when we add that to our graph:

Average Continuous Power
That’s right, the effective working power is half the peak power. In fact it is the average of the power sine wave. The average power is the power level the amplifier should be able to produce continuously. Hence it is known as the average continuous power. Specifications should use the average continuous power to state the amplifier power. “Continuous power” is a shortened term of “average continuous power”. Both terms refer to the (average) continuous power, or sustainable power, which an amplifier can produce with the specified load.
In many specifications for amplifier power you will see this referred to as the RMS power. This is not a correct term (because technically there is no such thing). Although the power calculation uses RMS voltage (and/or RMS current if you use other formulas) the result is simply “power”, not RMS power. As shown in the graph above, it is the average continuous power. However, for most amplifier specifications, you can consider RMS power (while an incorrect term) to refer to average continuous power.
Peak Power
Unfortunately marketing people don’t like saying their amplifier has a power of only 20 watts, when they consider they can truthfully say it has a maximum power of 40 watts. Which one would you buy, a 20 watt amplifier or a 40 watt amplifier? When looking at amplifier power, compare apples with apples – always use average continuous power, or the incorrectly termed RMS power (wrong term but correct power value).
However, it is legitimate to say what the amplifier’s peak power is. In the case of our example, it is 40 watts peak. But, peak power should always be accompanied with the phrase “peak power” or something similar. Peak power is often referred to as instantaneous power. Sometimes dynamic power is also used to describe the peak power.

It is important to remember that these descriptions are for the maximum power the amplifier could possibly deliver for a mere fraction of a second. They do not indicate the real long term power the amplifier is capable of producing. It is like saying you can fly a meter in the air because you can jump a meter in the air – for a brief moment. You can’t continually “fly” a meter in the air any more than an amplifier can continually produce its peak power.

PMPO
Peak Music Power Output (PMPO), or Peak Music Power (PMP) is a marketing term that rarely has any resemblance to reality. I prefer to say PMPO stands for Peak Marketing Power Output. It is a term marketers use to make their amps appear as being very powerful. The lower end of the market (like cheaper computer speakers and portable music boxes) tend to use PMPO. If I was to be generous, I would say they arrive at the PMPO value by taking the peak power, multiple it by the number of channels, and then multiple it by some unknown marketing factor between 10 and 1000. For example, the labeling on the box in this picture (brand name removed) claims this unit has a PMPO of 15,000 watts!
Notes about Amplifier Power
Amplifier power is not the only specification you should look at when deciding on a system. It may not even be as critical a factor as you think. For example, the level difference between 60 watts and 80 watts is just over 1dB, which is not very much. To have a 3dB increase in level you need to double the amplifier power. But this doesn’t mean the the volume will be doubled, for that you need to have 10 times the power! For more on this read the article on Double Amplifier Power doesn’t Double the Volume.
If getting the loudest system is your goal, you also need to look at the sensitivity of the speakers. Using a speaker with a sensitivity of 91dB over a speaker with with a sensitivity of 85dB gives a 6dB gain in speaker output for the same signal. This article on Speaker Sensitivity has more details.
Testing amplifier power with a sine wave is a harsh test for an amplifier. It is basically running the amplifier at 100% capacity continuously. A sine wave is not a normal everyday signal. Music and speech have many periods of lower than maximum level, and even pauses. Therefore an amplifier will not be stressed as much in normal use as when it is being stress tested. So some manufactures increase the power rating and use phrases like program power or music power to rate amps. However these ratings are not defined and shouldn’t be used for comparison purposes.
Variables with Amplifier Power
This article has outlined amplifier power, some of the terms used and a basic way of calculating amplifier power. However there are a number of other variables that should be known if you intend to compare amplifiers based on their specified power:
- While a simple sine wave is a convenient and relatively easy way to measure and calculate amplifier power, it only measures the power at a single frequency. It should also be capable of this power at other frequencies. Therefore, average continuous power levels should be accompanied by the test frequency or frequency range.
- The measured voltage used in the calculation is when the output is at its maximum, with no or little distortion to the signal caused by the amplifier. Some manufacturers measure the amplifier output when running with high distortion, giving an inflated power figure (again this mostly happens on low end products). Therefore, average continuous power levels should be accompanied by the tested signal distortion figures (THD or THD+n expressed as a percentage). This should be 1% or less – the lower the better. Beware of power output figures with 10% THD.
- The current, and therefore the power, changes as the load changes. A 4 ohm speaker allows more current than an 8 ohm speaker, so the power produced by the amplifier will change. Therefore, the stated power levels should be at specified test loads.
- Ensure the stated amplifier power is with all (or at least 2) channels of the amplifier driven at that power. Some manufactures only give the output power with one amplifier running, which is not a true indication of what the amplifier power supply can deliver when all channels are running.
All this is saying that you need to look closely at the specifications when comparing amplifiers by their power. Ideally, amplifier power should be stated similar to the following:
Amplifier power: 80 watts continuous average power @ 8 ohms (2 channels driven, THD 0.08%, 20Hz-20kHz)
Summary
We have seen through using a simple example that the best value to use for stating and comparing amplifier power is the average continuous power or other synonymous terms. Most terms using “peak” refer to possible power for very short time periods and are commonly used to inflate the real sustainable power levels.
The next article looks at real-world ways of how amplifier power is calculated, including some of the standards amplifier manufactures should adhere to for these tests. This will help in understanding some of the acronyms used like IEC, AES, DIN and FTC.
Before moving on, the following are two more terms that are useful to understand when talking and/or reading about amplifier and speaker power.
Clipping
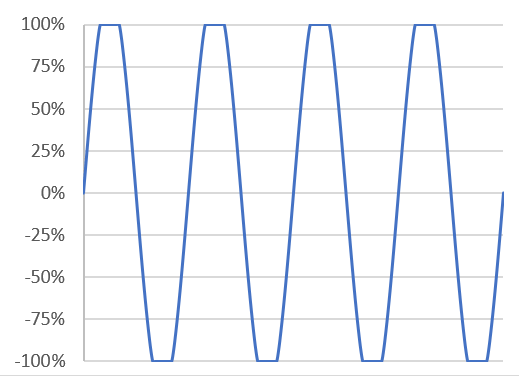
If the input signal is amplified such that the output is larger than the voltage limits of the amplifier, the sine wave will be clipped at the top and the bottom.
This graph shows the sine wave amplified to its maximum level without clipping. This is the level that should be measured for maximum power calculations.
This graph shows the sine wave over-driven by the amplifier such that it is clipping at the top and bottom. This distortion is not just annoying to the ear, it also stresses amplifiers and speakers and should be avoided.
Crest Factor
Crest factor is the ratio of the peak power to the average continuous power, expressed in dB. In our example, the peak power is 40 watts, the average continuous power is 20 watts. This is a ratio of 2:1 or 3dB. An amplifier tested using a simple sine wave (as in our example), will always have a crest factor of 3dB. That is, for a simple sine wave, the peak power is always going to be double the average continuous power.
For live music, with drums and other percussive instruments, the crash/bangs (peaks) could be 10-15 times above the average levels – that is a crest factor of 9-12dB. The table below outlines the relationship between decibels and the peak power to average power ratio.
| Crest Factor | Power Ratio |
| 3dB | 2:1 |
| 6dB | 4:1 |
| 9dB | 8:1 |
| 12dB | 16:1 |
| 15dB | 32:1 |
These figures will be useful as we look at how to match speakers to an amplifier.