Video Signals & Cables: RGB video

In this article we look at RGB video signal: what it is, where it is used, what cables to use and the problems with RGB video. This is the third in a series of articles outlining the different video signals used in home entertainment for connecting VCRs, DVDs, set top boxes, cameras and laptops to TVs and projectors. In the previous articles we looked at Composite video and S-video.

What is RGB video?

In a black & white video camera the image comes through the lens and onto the sensor which generates a video signal representing the image. In a colour video camera, after coming through the lens the signal is split into three different colours (red, green and blue) thrRGB prismough prisms. These coloured images then each go to a separate sensor, generating three separate video signals, one with the red picture information, one with the green picture information, and one with the blue picture information.  These three separate video signals (Red, Green and Blue) is what is known as RGB video. It is the most pure form of analogue colour video signal.

As well as the three full coloured signals, there also needs to be the timing information to make up picture. We need to appreciate that although a TV picture looks like it is a continuously moving picture, it is actually a series of still pictures (called frames) changing 25 or 30 times a second – and this looks like a continuously moving picture to our eyes. Each frame (still picture) is made up of lots of horizontal lines (525 or 625 lines). All these lines and frames need to be kept in time, or in sync, hence these timing signal are called horizontal sync (H) and vertical sync (V).

Some RGB video signals combine the sync signal with the green coloured picture and some have separate cables for each, requiring 5 signal paths in total.

Where RGB Video is Used

In many countries, RGB video is not used a lot with domestic equipment.

SCART comes from Syndicat des Constructeurs d’Appareils Radiorécepteurs et Téléviseurs. The plugs have 21 pins and allow RGB video, S-video and composite video (along with left and right audio). They are also know as Péritel, 21-pin EuroSCARTEuroconectorEuroAV and EIA Multiport.

The exception is in Europe, where SCART leads are used for connecting between DVD players, Set top boxes and displays.

A number of DVD players are capable of delivering RGB video at their output, but you normally have to enable this in the setup menu. However the display you are connecting to also needs to be able to received RGB video – this is not very common.

Where RGB video is commonly used, is when connecting a laptop to your display. Most flat screens and projectors will accept RGB, with seperate H and V sync (timing signals), referred to as RGBHV. This is the type of RGB video signal available from many computers.

SCART plug
Cables to Use for RGB Video

Scart connectors are widely used in Europe. They are convenient as the video and audio are connected through the one plug, reducing the confusion from having to plug in three video cables and two audio cables.

RGB video VGA plug
VGA Plug

The standard VGA (Video Graphics Array) plug has been used to connect computers to monitors for many years. They have 15 pins and carry the three RGB coloured signals and separate H sync and V sync. This is the best quality analogue colour signal that a computer can produce. VGA is now the generic term used for this type of plug and cable – it was originally introduced by IBM.  Good quality VGA cables can be run up to 50 metres (150 feet). Longer cable runs can use 5 seperate RG59 coax cables. Note: VGA cables only carries video signals, separate cables are are required for audio.

Problems with RGB Video

RGB video may well be the purest form of analogue colour video available, but it is a lot of information to be processed and stored. Remember it is three complete picture waveforms. Therefore it is not easily stored, especially by domestic recorders.

In the next article, we will discuss component video, and see why it is often used in domestic and commercial AV installations.


Reflections on the TV Remote Control

The recent passing of Eugene Polley, the man known for inventing the remote control, has given me cause to reflect on the development of the remote control. In just my life time, the humble TV remote control has come into existence and been developed rapidly.

Introducing the Flash-Matic Remote Control

Eugene Polley worked for American firm Zenith Radio Corporation (now owned by LG). In 1955 he invented the Flash-Matic, a light beam which was aimed at one of four different light sensors around the TV screen. It was possible to turn the TV on and off, and change channels. The 1956 ad for this ground breaking invention is reproduced below.  I like the line about it being “Absolutely harmless to humans!” It has been reported that this early system did have some problems in bright lights. However it is the forefather of the modern remote control which we now take for granted.

Introducing the Computermatic Remote Control

Early B&W and Colour TVs used a large channel knob to change channels. This required actually getting out of your chair to change channels (and to adjust the volume too). Therefore it was exciting to visit my grandparents house as they had a “computermatic” TV. This 1962 TV used a motor to rotate the channel changer. It also used a wired remote control, similar to the picture. Although there was a lead between the TV and the operator, it did allow remote control of the sound, picture (brightness) and the ability to change channels from the lounge chair. The channel button on the TV and the remote were labelled “FWD” and “REV”, as the motor rotated in the forward or reverse direction to change channels. This remote control also had a feature modern remote controls don’t have. Built into the remote control was a small speaker. The slide switch at the bottom of the remote control allowed the sound to come from the TV (receiver), the remote speaker, or to mute the sound. This allowed a young Geoff to watch and listen to TV when everyone else was in bed  – without disturbing them. The other good thing about this wired remote control is that it was hard to loose down the side of the lounge – you simply followed the lead to find it. It also did not require batteries!

 Wired Remote Controls

Wired remote controls became popular with many early Video Cassette Recorders (VCRs) . These wired remote controls allowed some tape playback control, mainly play/pause along with fast forward and review.

I recall around this era making a remote volume control and adapting our family TV to enable this volume control to adjust the TV sound – via a wire of course. But hey, this was a huge leap in interactive technology at our home, and the envy of many friends – fancy not having to get up to adjust the volume of the TV!

A good thing about these wired remote controls is that they were duplicating the controls on the front panel of the VCR, not replacing them. All functions could be easily controlled from the VCR even if the remote control was not lost or not working.

Cordless Remote Controls

The cheap availability of electronic tuners in TVs (and VCRs) made easy (and cheap) remote channel selection possible. This spawned the era of the common cordless remote control. So common, it seems every piece of home entertainment equipment needs its own remote control.

Apart from making you lazy by not having to get up to adjust the TV, these remote controls have raised several other issues. Not the least being many devices now rely on the remote control. If the remote control stops working or is lost, it is almost impossible to use most functions on the device.

Another issue is the problem of having to have a different remote control for each device. While universal remote controls are available, they don’t suit everyone, and can be more complicated to use, and they don’t always allow every function of the original remote control.

Taming the Remote Controls

A simple method to help manage several remote controls is to mount them on a board (a custom made board or a chopping board works well). Having all your remote controls mounted on the one board has several advantages:

  • as the remote controls are always in the same order it is easy to know which one to use for each device.
  • because they are in the same position, you quickly learn which button to press for each function.
  • they are always facing the same direction so you don’t need to turn each remote around to point it in the correct direction
  • a board is harder to loose down the side of the lounge

The Best New Feature

In my opinion the best new feature since the introduction of remote controls is shown in this picture. It is the little plastic tether strap which connects the battery cover to body of the remote control. This prevents the battery cover from being lost misplaced. Why wasn’t this thought of years ago?

Please leave your thoughts on the pros and cons of remote controls in the comment section below.


Understanding Speaker Sensitivity

Speaker sensitivity is a measurement of how well a speaker converts the amplifier power to acoustic energy. In others words, how loud the speaker will be for a given amplifier power.

How Speaker Sensitivity is Measured

Measuring speaker sensitivity is not difficult in concept, but is mainly done by speaker manufacturers and independent consultants.

speaker sensitivity measurement

Basically, the sound output of a speaker is measured with a calibrated sound level meter. To be consistent, speaker sensitivity should be measured 1 meter from the speaker with 1 watt of power coming from the amplifier.

A sound level meter measures Sound Pressure Level (SPL), and is measured in decibels (dB).

Therefore when you look at the specifications for a speaker, you will see something like:

Sensitivity: 87dB (1w/1m)

This means that speaker produces a level of 87dB when driven with 1 watt of power and measured 1 meter in front.

Comparing Speaker Sensitivity

Let’s say you are looking at three different speakers. In the specifications, under speaker sensitivity, for each speaker it states:

Speaker A: 84dB (1w/1m)    Speaker B: 87dB (1w/1m)    Speaker C: 90dB (1w/1m)

Speaker B will be 3dB louder than speaker A. This may not may seem much, but when you realize that 3dB is the same as doubling the amplifier power, it can be significant.

If you want to connect Speaker A and Speaker C to the same amplifier, then Speaker C will be 6dB louder than Speaker A.

When comparing speaker sensitivity figures, keep in mind that different manufactures may arrive at their figures differently. See the section below on “comparing apples with apples” for some of the differences you may come across or need to be aware of.

Sensitivity is just one factor of a speaker, it doesn’t indicate quality or lack of quality. Speaker sensitivity has nothing to do with the sound quality of the speaker, just how loud it will be for a given power input. It is just one issue for consideration when selecting speakers.

How to use speaker sensitivity

Speaker sensitivity can be used to determine how loud your speaker will be in different situations. Alternatively, it can help you determine how powerful an amplifier you will need.

The speaker sensitivity figure tells us how loud the speaker will be with a 1 watt amplifier, and when standing 1 meter away from the speaker.  But what happens when you increase the amplifier power, and/or increase the distance? Glad you asked, read on.

What if the power is increased?

As the amplifier power to the speaker is increased above the 1 watt reference, the output of the speaker will increase. Some general rules of thumbs to remember:

  • Doubling the amplifier power increases the speaker output level by 3dB
  • Using a 10 watt amplifier increases the speaker output level by 10dB
  • Using a 100 watt amplifier increases the speaker output level by 20dB
  • Using a 1000 watt amplifier increases the speaker output level by 30dB

Example 1: A speaker with a rated sensitivity of 87dB (1w/1m) when driven by a 100 watt amplifier (20dB gain over 1 watt) will produce a maximum sound level of 107dB (87+20) when measured 1 meter away.

Example 2: If you stand 1 meter away from a speaker with a rated sensitivity of 87db (1w/1m), then you will hear a level of 87dB if it is driven with 1 watt of power. If you double the amplifier power (to 2 watts) you add 3dB of gain and the speaker will now produce 90dB (87+3). Double the amplifier power again (to 4 watts) and you increase the output by another 3dB to 93dB.

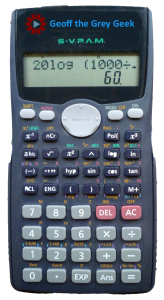
Use this calculator to see how the speaker output changes (when measured 1m away) as amplifier power changes (you can change the sensitivity and amplifier power figures).

What if the distance is increased?

The further you are away from the speaker, the lower the sound level (volume) you will hear from it. You might like to call this “air loss”. That is, this is how much sound level is lost in the air over the distance.

every time you double the distance, you hear a quarter of the sound level

The general rule is every time you double the distance, you hear a quarter of the sound level. Mathematically, the level decreases by 6dB every time you double the distance. If you want to sound technical, this is called the Inverse Square Law.

Example 3: A speaker with a rated sensitivity of 87dB (1w/1m) that is driven by a 100 watt amplifier, will produce a sound level of 107dB (see example 1 above) when measured at 1 meter. Double the distance to 2 meters, and the sound level will drop from 107dB by 6dB to 101dB. Double the distance again to 4 meters will decrease the level by another 6db to 95db.

Use the calculator below to see the level drop for different distances. Note: this rule applies in an ideal acoustic environment (like outdoors with no walls or reflections). Indoors there is often less air loss due to reflections caused by the walls, ceiling and floor.

Increasing power and distance

We have seen that increasing power to a speaker will increase its output level. We have also seen that the further you are away from a speaker, the less you hear.

This handy calculator will show you the level you can expect from your speaker when you know the sensitivity (1/w/1m), the amplifier power, and the distance from the speaker.

Note: The calculation for air loss applies to an ideal acoustic environment (like outdoors with no walls or reflections). Indoors there is often less air loss due to reflections caused by the walls, ceiling and floor. Up to 6dB less air loss could occur indoors (depending on the acoustics).

Beware of the Speaker’s Maximum SPL

Speaker sensitivity max or burnt speaker

When using speaker sensitivity to determine what power amp you should use, be aware of the maximum power your speaker can cope with lest you burn the coil in the speaker. This is normally also stated in the speaker specifications.

Some manufacturers will state the maximum power rating in the specifications. Others will state the maximum SPL of the speaker. In either case, don’t exceed their ratings.

2.83 volts instead of 1 watt

Some specifications don’t use 1 watt at 1 meter to state the speaker sensitivity. Instead they use 2.83 volts at 1 meter.

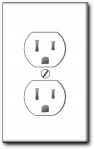
For an 8 ohm speaker, 1 watt of power from the amplifier is the same as 2.83 volts from the amplifier. As shown in the side box, if an amplifier outputs 2.83 volts into an 8 ohm speaker, then it produces 1 watt of power.

If you like to see a formula:\large{Power=\frac{Voltage^2}{Impedance}=\frac{2.83^2}{8}=\frac{8}{8}=1}

I understand the measurement standards states the amplifier should be set to output 2.83 volts. Possibly for ease of understanding speaker specifications, this is normally stated as 1w/1m, but is equally correct when stated as 2.83v/1m.

However the same is not true for a 4 ohm speaker. If 2.83 volts from the amplifier drives a 4 ohm speaker, it produces 2 watts of power. So for a 4 ohm speaker, 2.83v/1m equals 2w/1m.

Here’s another formula:\large{Power=\frac{Voltage^2}{Impedance}=\frac{2.83^2}{4}=\frac{8}{4}=2}

So when reading the speaker sensitivity specification, if you see 2.83 volts as the reference, check the impedance. If the speaker impedance is less than 8 ohms, then it is being driven by more than 1 watt of power.

There are at least two schools of thought on what to do about this discrepancy. One school says this is cheating, as you are driving a 4 ohm speaker with 2 watts, and not 1 watt. Therefore you are already doubling the power (that is, adding 3dB to the speaker’s output). Another school of thought says, hey, that is the inherent sensitivity of the 4 ohm speaker so live with it.

The calculators above are based on 1 watt of input power. So when using 2.83 volts into 4 ohms, you will need to reduce the speaker sensitivity figure by 3dB to obtain the correct result. (Remember doubling the amplifier power (to 2 watts) adds 3dB  to the speaker output. So to halve the output (back to 1 watt), you need to subtract 3dB).

Comparing Apples with Apples

We have seen that some manufacturers use 1 watt, others use 2.83 volts as the input level. There are also other differences in how manufacturers measure the sensitivity which are not so obvious, but can make a significant difference.

Some manufacturers measure at just one frequency (probably the most sensitive frequency). Others might measure at several frequencies and then average the results. Others might state each frequency. Pink noise, which is a combination of all frequencies, might be used by other manufactures.

Some testers may measure in line with the most efficient speaker in a cabinet, others might measure at the center axis of the cabinet. Some might do the measurements in a perfect non-reflective environment, others might do in a real world environment. Some might measure further away than 1 meter, and then calculate the 1m figure.

All these differences can subtract from the purpose of having an objective method of comparing speaker sensitivity. These differences are also difficult to ascertain as few manufactures include these details in their specifications.

None the less, using the speaker sensitivity specification should give you a good guide as to how loud a speaker will be at a specified distance and a specified amplifier power input.

Is Speaker Sensitivity and Efficiency the Same?

Speaker sensitively and efficiency are related, but not the same. Although in general discussions among non-technical people the terms are often interchanged – especially by marketing people.

Technically, efficiency is the ratio between amplifier input power and speaker acoustic output power. Efficiency is calculated and stated as a percentage.

The truth of the matter is speakers are not very efficient at converting amplifier power to acoustic power. Speaker efficiency is normally around 0.1% – 2%.  This figure is not as useful to us as a speaker sensitivity dB figure which we can easily use in a calculations.

Summary

Speaker sensitivity figures are used to calculate how loud a speaker will be at a given distance and a given amplifier power. It is just one issue for consideration when selecting speakers. It doesn’t indicate sound quality or lack of sound quality.
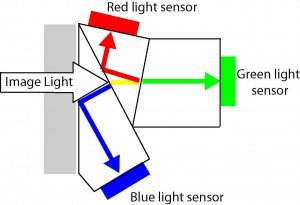
Understanding Amplifier Power

Amplifier power is probably the most misunderstood and abused parameter of amplifiers and speakers. Yet, it is often the first (and possibly only) parameter people look at when buying an amplifier or speakers.

Marketing managers add to the confusion by using terms like RMS power, continuous average power, music power, peak power, dynamic power, maximum power etc.

Understanding amplifier power will help in understanding the terms often used (and abused) to describe amplifier power. This article will explain what amplifier power is, and what is it is not. Further articles will explain how amplifier manufacturers measure power, what speaker power is and how to match your amplifiers and speakers. Before all that we need to understand amplifier power.

Amplifier Power is Calculated, not Measured

A Voltmeter measures voltage in volts. An Ammeter measures current in amps (amperes). An Ohmmeter measures resistance in ohms. Any two of these measurements will allow calculation of amplifier power (in watts). Unfortunately this means using some math and some formulas. I’ll try to keep it simple and only use one formula. If you like formulas and want to understand how power, voltage, current and resistance inter-relate, you can read my articles on Electrical Power and Ohms law. Otherwise, accept the following formula:

Power = Voltage squared divided by Resistance.

Let’s use this formula with a simple example. Let’s say you have an amplifier connected to a 5 ohm load (I’ve used 5 ohms to keep the calculations simple – normally it would be 4 ohms or 8 ohms for a speaker). With a constant sine wave input, you measure 10 volts AC on the speaker output of the amplifier. Since you know the resistance (5 ohms) and the voltage (10 volts), you can calculate the power:

Power = (10 times 10) divided by 5  = 100/5 = 20 watts. 

Simple eh? 

Understanding AC Measurements

Well that was a simple example. In reality it is not that simple for a number of reasons. The major complication is the output is not a constant level because the input is not a constant level. Let’s start with the simple input of a sine wave. The output would also be a sine wave, like this:

Understanding Amplifier Power - sine wave

As you can see, the input and output is not constant. It is continuously going up and down, positive and negative. This is the case for any AC (Alternating Current) signal. Yet when you measure it with a meter, you get a constant voltage. This is because a meter tells you the RMS voltage.

Understanding Amplifier Power - RMS is 70.7% of peak

RMS stands for Root Mean Square (which you can now forget). It is a mathematical term for what is effectively the working voltage. It is a calculation to determine the equivalent heating effect of a DC voltage. No need to get too involved in how RMS is determined, just remember it is the effective working voltage. It is also the voltage that your meter measures. It is 70.7% of the peak voltage. 

This is the case for all AC measurements. For example, the power outlet in some countries is 120 volts AC – this is the RMS voltage. The sine wave of 120 volts AC goes from +169.5 volts to -169.5 volts or a peak to peak (p-p) voltage of 339 volts. 70.7% of 169.5 volts gives the RMS voltage of 120 volts. In countries using 230 volts, the peak voltage is +/- 325.3 volts.

Measuring Amplifier Voltage and Current

OK, now we know RMS is the effective working voltage (and current) of AC.  How does this help us with understanding amplifier power? Glad you asked.

Understanding Amplifier Power - RMS and peak power example

In our simple example above we measured 10 volts RMS at the output of the amp. This means the output actually went from +14.14 volts to -14.14 volts.  70.7% of 14.14 volts is 10 volts.

Calculating Amplifier Power

Now the fun part. We said earlier that power equals voltage squared divided by the resistance. This is true at any point along the sine wave. So if we take the voltage value (shown in blue) and square it (multiple it by itself) and then divide that by the constant resistance (5 ohms), we would get the power output as shown in orange: 

Understanding Amplifier Power - Peak power calculation

A couple if things to note from this graph:

  • Firstly, AC power does not go positive and negative. It is always positive. Therefore the RMS calculation does not apply.
  • Secondly, the power is 40 watts peak to peak. However, you can’t say the power of the amplifier is 40 watts because it is only that at the peaks of each sine wave, not at any other time.

You can use my Amplifier Power, Voltage and Current Calculator to easily see the RMS and Peak values for your amplifier based on it specifications.

Now let’s look at the RMS values. In our example, we know the RMS voltage is 10 volts. We saw earlier that 10 squared is 100, and 100 divided by 5 gives us a calculated power of 20 watts. Let’s see what happens when we add that to our graph:

Understanding Amplifier Power - peak vs RMS

Average Continuous Power

That’s right, the effective working power is half the peak power. In fact it is the average of the power sine wave. The average power is the power level the amplifier should be able to produce continuously. Hence it is known as the average continuous power. Specifications should use the average continuous power to state the amplifier power. “Continuous power” is a shortened term of “average continuous power”. Both terms refer to the (average) continuous power, or sustainable power, which an amplifier can produce with the specified load.   

In many specifications for amplifier power you will see this referred to as the RMS power. This is not a correct term (because technically there is no such thing). Although the power calculation uses RMS voltage (and/or RMS current if you use other formulas) the result is simply “power”, not RMS power. As shown in the graph above, it is the average continuous power. However, for most amplifier specifications, you can consider RMS power (while an incorrect term) to refer to average continuous power.

Peak Power

Unfortunately marketing people don’t like saying their amplifier has a power of only 20 watts, when they consider they can truthfully say it has a maximum power of 40 watts. Which one would you buy, a 20 watt amplifier or a 40 watt amplifier? When looking at amplifier power, compare apples with apples – always use average continuous power, or the incorrectly termed RMS power (wrong term but correct power value).

However, it is legitimate to say what the amplifier’s peak power is. In the case of our example, it is 40 watts peak. But, peak power should always be accompanied with the phrase “peak power” or something similar. Peak power is often referred to as instantaneous power.   Sometimes dynamic power is also used to describe the peak power.

understanding amplifier power- peak power like jumping

It is important to remember that these descriptions are for the maximum power the amplifier could possibly deliver for a mere fraction of a second. They do not indicate the real long term power the amplifier is capable of producing. It is like saying you can fly a meter in the air because you can jump a meter in the air – for a brief moment. You can’t continually “fly” a meter in the air any more than an amplifier can continually produce its peak power.

Understanding Amplifier Power - PMPO 15000W

PMPO

Peak Music Power Output (PMPO), or Peak Music Power (PMP) is a marketing term that rarely has any resemblance to reality. I prefer to say PMPO stands for Peak Marketing Power Output. It is a term marketers use to make their amps appear as being very powerful. The lower end of the market (like cheaper computer speakers and portable music boxes) tend to use PMPO. If I was to be generous, I would say they arrive at the PMPO value by taking the peak power, multiple it by the number of channels, and then multiple it by some unknown marketing factor between 10 and 1000. For example, the labeling on the box in this picture (brand name removed) claims this unit has a PMPO of 15,000 watts! 

Notes about Amplifier Power

Amplifier power is not the only specification you should look at when deciding on a system. It may not even be as critical a factor as you think. For example, the level difference between 60 watts and 80 watts is just over 1dB, which is not very much. To have a 3dB increase in level you need to double the amplifier power. But this doesn’t mean the the volume will be doubled, for that you need to have 10 times the power! For more on this read the article on Double Amplifier Power doesn’t Double the Volume.

If getting the loudest system is your goal, you also need to look at the sensitivity of the speakers. Using a speaker with a sensitivity of 91dB over a speaker with with a sensitivity of 85dB gives a 6dB gain in speaker output for the same signal. This article on Speaker Sensitivity has more details.

Testing amplifier power with a sine wave is a harsh test for an amplifier. It is basically running the amplifier at 100% capacity continuously. A sine wave is not a normal everyday signal. Music and speech have many periods of lower than maximum level, and even pauses. Therefore an amplifier will not be stressed as much in normal use as when it is being stress tested. So some manufactures increase the power rating and use phrases like program power or music power to rate amps. However these ratings are not defined and shouldn’t be used for comparison purposes.

Variables with Amplifier Power

This article has outlined amplifier power, some of the terms used and a basic way of calculating amplifier power. However there are a number of other variables that should be known if you intend to compare amplifiers based on their specified power:

  • While a simple sine wave is a convenient and relatively easy way to measure and calculate amplifier power, it only measures the power at a single frequency. It should also be capable of this power at other frequencies. Therefore, average continuous power levels should be accompanied by the test frequency or frequency range.
  • The measured voltage used in the calculation is when the output is at its maximum, with no or little distortion to the signal caused by the amplifier. Some manufacturers measure the amplifier output when running with high distortion, giving an inflated power figure (again this mostly happens on low end products). Therefore, average continuous power levels should be accompanied by the tested signal distortion figures (THD or THD+n expressed as a percentage). This should be 1% or less – the lower the better. Beware of power output figures with 10% THD.
  • The current, and therefore the power, changes as the load changes. A 4 ohm speaker allows more current than an 8 ohm speaker, so the power produced by the amplifier will change. Therefore, the stated power levels should be at specified test loads.
  • Ensure the stated amplifier power is with all (or at least 2) channels of the amplifier driven at that power. Some manufactures only give the output power with one amplifier running, which is not a true indication of what the amplifier power supply can deliver when all channels are running.

All this is saying that you need to look closely at the specifications when comparing amplifiers by their power. Ideally, amplifier power should be stated similar to the following:

Amplifier power: 80 watts continuous average power @ 8 ohms (2 channels driven, THD 0.08%, 20Hz-20kHz)

Summary

We have seen through using a simple example that the best value to use for stating and comparing amplifier power is the average continuous power or other synonymous terms. Most terms using “peak” refer to possible power for very short time periods and are commonly used to inflate the real sustainable power levels.

The next article looks at real-world ways of how amplifier power is calculated, including some of the standards amplifier manufactures should adhere to for these tests. This will help in understanding some of the acronyms used like IEC, AES, DIN and FTC.

Before moving on, the following are two more terms that are useful to understand when talking and/or reading about amplifier and speaker power. 

Clipping

If the input signal is amplified such that the output is larger than the voltage limits of the amplifier, the sine wave will be clipped at the top and the bottom.

Understanding Amplifier Power - 100% sine wave

This graph shows the sine wave amplified to its maximum level without clipping. This is the level that should be measured for maximum power calculations.

Understanding Amplifier Power - clipping at 100 %

This graph shows the sine wave over-driven by the amplifier such that it is clipping at the top and bottom. This distortion is not just annoying to the ear, it also stresses amplifiers and speakers and should be avoided.

Crest Factor

Crest factor is the ratio of the peak power to the average continuous power, expressed in dB. In our example, the peak power is 40 watts, the average continuous power is 20  watts. This is a ratio of 2:1 or 3dB. An amplifier tested using a simple sine wave (as in our example), will always have a crest factor of 3dB. That is, for a simple sine wave, the peak power is always going to be double the average continuous power. 

For live music, with drums and other percussive instruments, the crash/bangs (peaks) could be 10-15 times above the average levels – that is a crest factor of 9-12dB. The table below outlines the relationship between decibels and the peak power to average power ratio.  

Crest FactorPower Ratio
3dB2:1
6dB4:1
9dB8:1
12dB16:1
15dB32:1

These figures will be useful as we look at how to match speakers to an amplifier.

Amplifier Power, Voltage and Current Calculator

2

This calculator for amplifier power, voltage and current has little significance but is rather interesting.

In the specifications for an amplifier, it might say something like this:

This is telling you the RMS power (or more correctly, the continuous power) with a 8 ohm load and a different continuous power with a 4 ohm load. But what is the peak power? What is the output RMS voltage and peak-peak voltage? What current is the amplifier delivering through the speakers?

This calculator displays the continuous power, peak power, RMS voltage and peak to peak (p-p) voltage. It displays these results in numbers and graphically. It also calculates the RMS current and peak current.

Simply type in the RMS or Continuous power as stated in the specs, and then enter the test load used (eg. 4 ohms or 8 ohms)

Note: the calculator is best viewed in landscape mode on phones and small screens

So what can you do with the results of this calculator? Absolutely nothing!

It is for information only. It is for those of you who like to understand and/or visualize what the specs mean and what your amplifier is doing.

These calculations are for a setup similar to how manufacturers test the power capabilities of their amplifiers. They normally drive the amplifier with a sine wave into a test load (normally 4 ohms or 8 ohms) which is not normally a speaker, but rather a constant value non-inductive resistor.

For and explanation of these terms and measurements, see the article on Understanding Amplifier Power.

Video Signals & Cables: S-Video

In this article we look at S-video signal: what it is, what cables to use, where S-video is used and the problems with it.  This is the second in the series of articles outlining the different video signals used in home entertainment for connecting VCRs, DVDs, set top boxes, cameras and laptops to TVs and projectors. In the previous article we looked at Composite Video.

What is S-Video?

S-Video is an improvement on Composite Video as the luma and chroma stay separated. S-Video was introduced with Super VHS Video Cassette Recorders as these higher quality devices recorded the luma and chroma separately on to the video tape. This overcame the problem of having to separate these two components in the TV, as they were already separated (they were not mixed in the first place). By keeping the luma and chroma separate throughout the whole signal path, the resulting picture appears crisper with less colour smear compared to composite video.

The “S” in S-video normally means “Super” video (like Super VHS) or “Separated” video. In a S-video signal, the sync (timing information) is still combined with the luma information. In technical articles, the luma signal (black & white picture information) is represented by the letter “Y”. Chroma (the colour information) is represented by the letter “C”. Hence S-video can also be referred to as Y/C video signal.

Cables to use for S-video

S video connector

s video connector

The normal connecter for S-Video uses 4 pins: 2 pins for “Y” (luma) and 2 pins for “C” (chroma). The cable needs to have two separate pairs (4 wires in total). Pre-made S-video cables are normally available in lengths up to 15 metres (50 foot).  For longer cables, it is normal to use a breakout cable at each end, and install two RG59 video cables in between.

Please be careful when using a S-video plug, make sure it is orientated the right way as the pins are easily bent if forced in the the wrong way.

Click here to browse S-video cables available from Amazon

Disclosure: If you buy through this link Geoff receives a small commission from Amazon

Some devices also use a 7 pin socket. A 4 pin S-video plug should plug into a 7 pin socket with the 4 pins connecting to the right sockets containing the luminance and chroma signal.

Where S-video is Used

S-video is not regularly used these days as there are better ways to connect video signals. However it is still widely available on many DVD players, Set Top Boxes (STB) and game consoles. Older laptop computers also have a S-video connector (although often 7 pin).

To connect a screen or projector with a S-video cable, it needs to have a S-video socket, as does the DVD player or STB.

Problems with S-video

Although S-video is better than composite video in that the chroma (colour) and luma (picture content) are separated, there are still problems with S-video. Colour content for video is made up of red, blue and green. In S-video, all this colour information is combined into one signal path and cable and is therefore compromised.

In the next articles we look at RGB video signals, and then component video, where the colour information remains separate.


Phone & Ipod Chargers


Do phone chargers and Ipod chargers draw power when not connected to their device? The answer is: it depends on the type of charger.

There are two basic types of technologies used in power supplies (a charger is basically a power supply). It is useful to have a general understanding of the two types of power supplies. So, without getting into the technical issues, the two technologies are:

1) Transformer Power Supplies

Transformers have been traditionally used in power supply designs for many years. A transformer transforms high AC voltage to low AC voltage. Then some simple circuitry changes the AC to DC.

2) Switch Mode Power Supplies (SMPS)

Switch mode power supplies are a newer technology. They convert the AC to DC, then switch the DC on and off very quickly at different rates to produce the required voltage.

Differences

The major differences are outlined in the table below.

Transformer Power SupplySwitch Mode Power Supply
Produce heat even when not used, so are less efficientProduce little or no heat when not used
Have a heavy transformer in themDo not have a heavy transformer
Have a narrow or fixed input voltage (like 230-240 volts)Can have a wide input voltage (like 100-250 volts)
Draws some power even with no loadDraws negligible power with no load

So it is simple to tell which type of power supply your phone or Ipod uses for its charger. If it is warm when not connected, has very limited input voltage range (read the label) and feels a bit heavy for its size, then it is probably a transformer power supply.

If it doesn’t get warm when not connected, has a wide input voltage, and feels like there is nothing in it, then it is probably a switch mode power supply.

So, does your charger draw power when not plugged into its device? The above table gives some hints to this answer. In practical tests, I cannot measure the power drawn by my switch mode power supply phone charger when not plugged into my phone, as it is too low for my power meter to read. It did draw about 4 watts when connected to the phone and charging. It reduced to 2 watts once the phone was charged.

On the other hand, when I measured the power drawn from a transformer power supply, it measured 3 watts with nothing connected to it.

I want to thank Mark from Canberra, Australia for asking this question. I hope this helps you understand and use your technology better.

Speaker Dispersion Calculator

1

If you look at the specifications of speaker boxes, you should see something like Dispersion (H x V): 90 x 50. This is stating the nominal angle of high frequency dispersion in the horizontal and vertical plane.  These figures can be used to calculate the nominal spread of the high frequencies in the horizontal and vertical plane (who said all that trigonometry at school was useless?)

Using the calculator below, simply enter the values in the horizontal and vertical angle boxes. Also enter the distance of the measuring point to the speaker (and select feet or metres).

Example 1: The seating area of a small church or hall is 10 meters deep. Use “5” as the throw distance to determine the width of the high frequencies spread half way down the hall.

Example 2: Ceiling speakers (often rated at 110 degrees (circular spread)) are to be mounted on a ceiling 2.4 metres (8ft) high. If the audience is predominately seated you would use a throw distance of 1.2 metres (2.4m – 1.2m) or 4ft (8ft-4ft). This assumes the height of a sitting person is 1.2 metres (or 4ft). Note: for ceiling speakers with a uniform dispersion angle (circular), simply use the same input (110 degrees) for both horizontal and vertical.

Download Calculator
as Excel File
Prices in US$

Note: These calculations only give an approximation as the specified figures used are only an average of different high frequencies, and are given for when the SPL at these frequencies are 6dB below the level directly in front of the speaker. However they give a good indication of the expected spread of the high frequencies (required for good speech intelligence).

For those who need to know, the formula used for these calculations is:

\large Width\  of\ spread = {tan\left(\frac{angle}{2}\right) \times Throw\, Distance \times 2}

Speakers in Series Calculator

1

The calculator below is useful in determining the total impedance of speakers in series. It also calculates how the power is shared between the speakers.

Simple Impedance Calculation for Speakers in Series

Do you need a calculator to determine the total load impedance of speakers in series? Probably not. The calculation to determine the total impedance of speakers in series is easy. Simply add the impedance of each speaker to get the total impedance.

Example 1: An 8 ohm speaker in series with a 4 ohm speaker = 12 ohms.

Example 2: Four 4 ohms speakers in series = 16 ohms.

So if calculating the impedance of speakers in series is so simple, why do we need a calculator? My point exactly. I’ve always thought there is no need for such a calculator. After all, most people can add 4+8 and get 12 as the answer. However I’ve had some requests for such a calculator. Hopefully the power sharing calculations are the driving force for these requests and not the total impedance calculation.

Impedance Calculator

Below is my calculator for 2, 3 or 4 speakers wired in series. Although I’m not sure why you would want to connect 4 speakers in series, but if you do, this calculator will help.

Simply type the impedance of each speaker into the white boxes (or use the drop-down values). Use N/A for unused speakers in this calculator. The total impedance will be calculated for the entered speakers.

Also calculated for each speaker is its percentage share of the amplifier’s output power. This is useful as power sharing is a consideration when using speakers with different impedance.

“Power Differential” is the final calculation of the top section. This calculates in dB (decibels) the power level difference between the highest and lowest power as it is shared across the speakers. This shows the power level difference when using speakers with different impedance.

Amplifier Power Calculator

The bottom section of the calculator helps in matching the speaker combination with your amplifier. This is not necessary if you only want to know the total impedance and/or the power ratios.

However if you are connecting these speakers to your amplifier, it may be helpful to input the amplifier power and the associated speaker impedance. In the specifications for your amplifier, it should say something like :

Amplifier power: 80 watts continuous average power @ 6 ohms (2 channels driven, THD 0.08%, 20Hz-20kHz)

This tells you the maximum continuous power the amplifier will deliver into a 6 ohm load is 80 watts. In the calculator below, for this example, you type in 80 for the power and 6 for the impedance. Be aware, some specifications state RMS power rather than continuous power. These are effectively the same.

The calculator will display the effective power of the amplifier for the calculated total impedance of the series speakers. Also displayed (under each speaker’s power %) is the actual maximum power the amplifier will supply each connected speaker. A comment on the suitability of the calculated total impedance for your amplifier is also provided.

Note: the calculator is best viewed in landscape mode on phones and small screens

Note: the calculated output power for the amplifier is based on a theoretical “ideal” amplifier. In practise, your amplifier may produce slightly more power.

Need to know more?

This calculator will help you understand the total speaker load on your HiFi amplifier. For a better understanding of this and what to do about it, read the articles How do I Connect Multiple Speakers to my HiFi Amplifier and How to wire four HiFi speakers or How to connect 2 speakers to one amplifier or watch the video in the article Understanding Speaker Impedance. .

Also see How Multiple Speakers Share Power for further details about the percentage power calculations. For more details about the effective amplifier power at higher impedance loads, see How Impedance Changes Amplifier Power.

If you need to calculate the impedance and power sharing of speakers in a different configuration, you can use my Speakers in Parallel Calculator, or the Speakers in Series/Parallel Calculator.

If you need further advice on connecting speakers in series, please read the FAQs before submitting your question.

Speaker Cable Loss Calculator

This speaker cable loss calculator simply tells you how much resistance is in your speaker cables and what decibel(dB) and power losses are attributed to your speaker cable. It also calculates the effective damping factor.

This speaker cable loss calculator is designed for low impedance systems – like Hi-Fi, home theatre and other music systems. Low impedance is a term used to refer for systems where the amplifiers are designed for speakers which have a nominal impedance of 2 to 16 ohms. High impedance systems are commonly called 70 volt or 100 volt systems, and are used mostly in commercial installations requiring more than 2 speakers connected to each amplifier. This calculator can be used to calculate speaker cable loss on high impedance systems.

Like all my calculators, simply input the required information in the white cells.

Units of Measure

First up, select the units of measure. Either “Metres & mm²” or “Feet & AWG” can be selected by clicking on the white cell and selecting from the drop down options. Most countries use metric, meaning the cable lengths are measured in metres, and the cable size is in mm².  For countries not using metric, select “Feet & AWG” – the cable lengths will be in feet and cable size will be the AWG gauge number.

Cable Length and Size

Then the next two cells to fill in are the cable length and the cable size:

  • Cable length refers to the length of the cable from the amplifier terminals to the speaker terminals.
  • Cable size refers to the thickness of the speaker cable. What you enter here depends on the units of measure you chose.
Metres & mm²Feet & AWG
Enter the Cross Sectional Area (c.s.a.) of the cable in mm²
(Eg. 0.75mm² )
Enter the AWG gauge number
(Eg. #18 gauge)

Specified Speaker Impedance

Speaker impedance is the impedance stated on the back of the speaker or in the speaker’s manual. It should be specified in ohms (the symbol for ohms is “Ω”). It is normally 4Ω, 6Ω or 8Ω.

    Calculated Cable Losses

    Once the above values are entered, you can see the calculated results in the box labelled “Calculated Cable Losses”. Here you will see the total resistance of the cable, and the resulting decibel (dB) reduction in power reaching the speaker due to the cable loss.

    For many people, that is sufficient information. For example if you just want to know if your cable losses are greater or less than say 0.5dB, then you have that information.

    However, if you want to know more about how the cable affects your amplifier and speaker system, then you can add in your amplifier specifications.

    Amplifier Specifications

    • Specified amplifier power should be in the amplifier’s manual or specifications. Keep in mind that some manufacturers only state their absolute maximum power ratings, which are generally not sustainable for longer periods of listening or are come with considerable distortion. I advise you use the most conservative ratings, which should be stated as “Average Continuous Power”, “Continuous Power” or “RMS Power”. A major Hi-Fi manufacturer shows the following in their specifications:

    Here they use “Rated Output Power” for their conservative ratings. Notice the THD (Total Harmonic Distortion) is very low (0.07%), unlike their stated maximum power which has 10% THD!

    Note that all power output ratings of an amplifier are at a specified impedance. For best results in the calculator, use the stated output power at the impedance closest to your speaker’s impedance. For example, if you have an 8 ohm speaker connected to the amplifier, using the specification above, enter “90” for the stated output power, and “8” for the load impedance.

    If the specifications only have a power rating at one stated impedance (Eg: 100 watts @ 4 ohms), use that specified output power and that specified load impedance.

    Damping factor should be another listing in the specifications of the amplifier. If it is, and it is something you are concerned about, then also enter the stated amplifier damping factor in the white cell.

    If you can’t find the damping factor, or it is of no or little interest to you, then it doesn’t matter.

    Calculated Damping Factor & Maximum Power

    This box uses a simple diagram to display the maximum power output of the amplifier, the maximum power loss in the cable, and the resulting maximum power reaching the speaker. Note, these values are based on the amplifier running at the specified maximum continuous power.

    The calculated damping factor is also displayed in this box.

    Note: the calculator is best viewed in landscape mode on phones and small screens

    Download Calculator
    as Excel File
    Prices in US$

    What do the results mean?

    While the results of the above speaker cable loss calculator are theoretically correct, how they are interpreted will depend on which school of thought you subscribe to, how good you think your ears are and how much you care.

    Some people suggest the cable losses should be less than 0.3dB. Others say anything less than 0.5dB is not discernible. Others say that if you don’t run the system at maximum power, then simply adjust the amplifier volume control to the level you want and you don’t need to worry about any losses.

    Then there is the damping factor to consider (or not). If you’re unaware of damping factor (DF), then there are myriads of articles about it, and just as many suggestions as to what value you should aim for.

    Basically, the effective DF indicates the ability of the amplifier to control the speaker’s movement (especially any overshoot). It mainly concerns the low frequencies, and a low DF can result in the some of the low frequencies (like a kick drum) sounding a bit soft or “muddy”.

    Some people suggest the effective damping factor should be above 100. Others suggest 50 is good to aim for, and others suggest 10-25 is acceptable. Other people don’t care. It is mostly regarded that the higher the effective DF the better.

    The effective DF is mostly determined by the cable resistance and the speaker impedance. An 8 ohm speaker will almost double the effective DF compared to a 4 ohm speaker. Decreasing the cable loss (by using a thicker and/or shorter cable) will increase the effective DF.

    Summary

    Speaker cable loss is something to be considered, along with many other factors like speaker impedance, sensitivity, power rating and frequency range, amplifier power, and budget.

    A thicker speaker cable will decrease the cable loss, increase the damping factor, and increase the cost.